KIT
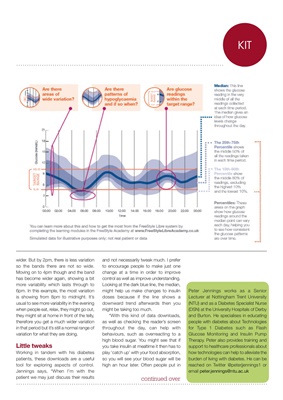
wider. But by 2pm, there is less variation
so the bands there are not so wide.
Moving on to 4pm though and the band
has become wider again, showing a bit
more variability which lasts through to
6pm. In this example, the most variation
is showing from 8pm to midnight. It's
usual to see more variability in the evening
when people eat, relax, they might go out,
they might sit at home in front of the telly,
therefore you get a much wider variation
in that period but it's still a normal range of
variation for what they are doing.
Little tweaks
Working in tandem with his diabetes
patients, these downloads are a useful
tool for exploring aspects of control.
Jennings says, "When I'm with the
patient we may just discuss their results
and not necessarily tweak much. I prefer
to encourage people to make just one
change at a time in order to improve
control as well as improve understanding.
Looking at the dark blue line, the median,
might help us make changes to insulin
doses because if the line shows a
downward trend afterwards then you
might be taking too much.
"With this kind of data downloads,
as well as checking the reader's screen
throughout the day, can help with
behaviours, such as overreacting to a
high blood sugar. You might see that if
you take insulin at mealtime it then has to
play 'catch up' with your food absorption,
so you will see your blood sugar will be
high an hour later. Often people put in
continued over
Peter Jennings works as a Senior
Lecturer at Nottingham Trent University
(NTU) and as a Diabetes Specialist Nurse
(DSN) at the University Hospitals of Derby
and Burton. He specialises in educating
people with diabetes about Technologies
for Type 1 Diabetes such as Flash
Glucose Monitoring and Insulin Pump
Therapy. Peter also provides training and
support to healthcare professionals about
how technologies can help to alleviate the
burden of living with diabetes. He can be
reached on Twitter @peterjjennings1 or
email peter.jennings@ntu.ac.uk